
June 3, 2014
Signal Quality Measurement Techniques
How do you know what you have? ... and SQM ApplicationsOverview
"How's my signal, OM?" is probably the most often asked question on the ham bands, mainly because most amateurs don't have the instrumentation to measure or otherwise determine how good their transmitted audio or RF signal quality is. Techniques for determining signal quality range from the simple and seat-of-the-pants types of approaches, to the complex, esoteric and expensive methods that many of us perhaps only dream about being able to perform.
In this episode of CWTD we'll explore different aspects of what constitutes "good signal quality" ... and inexpensive ways you might consider being able to determine if you have it!
73, George N2APB & Joe N2CXComments from the Chat Window:
<20:26:04> "Pete - WB2QLL": Or a receiver you can use as well
<20:34:03> "Howie K3HW": audio input on my iBook G4 is shot
<20:35:30> "Todd K7TFC": What kind of device can do FFTs on a signal and just spit out the spectrum components, i.e., no display.
<20:35:58> "Ray K2ULR": the iMSO-204 is supposed to be good to 5 MHz
<20:36:03> "Todd K7TFC": I.e., spit them out as numbers.
<20:41:49> "Jim N5IB": Joe - how does 8310 compare with 8307 ? Does the lower intercept really help?
<21:05:05> "Todd K7TFC": Can you confirm that harmonic #1 is actually the fundamental and not a harmonic at all?
<21:05:50> "Ray K2ULR": That's true... 1st harmonic = fundamental
<21:08:55> "Todd K7TFC": It's like a company I worked for where "rev.A" was the original and not a revision.
<21:17:08> "Todd K7TFC": They're embedded
<21:17:10> "Howie K3HW": It worked for me George
<21:23:31> "Nick WA5BDU": agile!
<21:25:08> "George N2APB": YES! Agile was the word I was searching for ))
CWTD Episode #69: Signal Quality Measurement Techniques
... How do you know what you have?
We often want to check the purity of our signals
Easy to do at audio
Distortion analyzer – more properly THD Analyzer
Measure harmonic distortion of audio sine wave
Measure sine wave signal voltage/power
Notch out fundamental and measure remainder
Ratio of two is Total Harmonic Distortion
THD Analyzer, from Wikipedia ...
Total Harmonic Distortion (THD) Analyzers calculate the total harmonic content of a sinewave with some distortion, expressed as total harmonic distortion (THD). A typical application is to determine the THD of an amplifier by using a very-low-distortion sinewave input and examining the output. The figure measured will include noise, and any contribution from imperfect filtering out of the fundamental frequency. Harmonic-by-harmonic measurement, without wideband noise, can be measured by a more complex wave analyser.
Another application is measurement of the effectiveness of an electronic filter with extremely narrow passband, such as a notch filter in a parametric equalizer.
Measuring SINAD of audio in transmitted signal
(ratio of Signal To Noise And Distortion)
Simple device to do this is Sinadder™ ...
Sinadder <http://www.teknetelectronics.com/Pics/WEBHELPESINADDER.jpg>
Used by FM two-way radio techs to measure receiver sensitivity
Sensitivity spec'ed as signal in uV for 12 dB SINAD
Hooked up to receiver audio and automatically calculates SINAD from THD and noise
Spectrogram program ...
uses Audio card in PC to show audio spectrum
At RF ...
One way is to have someone listen to our signal and see how it sounds
And tune off-freq to check for unwanted spurii
Nearby observer can check for harmonic signals
Absorption Wavemeter
Early way to measure signal was by using an absorption wavemeter
Triplet 3256The Absorption wavemeter is a simple device for the measurement of radio frequency energy at different frequencies.
The device can be used by the users of radio equipment to check the approximate frequency of a strong signal source, and also to check the output of a transmitter forharmonics. Many radio amateurs use one to check the purity and frequency of their transmitters [1][2][3]. Also devices can be made which work in the same way that are able to detect mobile phones [4]. As an alternative a dip meter can be used.
The most simple form of the device is a variable capacitor with a coil wired across its terminals. Attached to one the terminals of the LC circuit is a diode, then between the end of the diode not wired to the LC circuit and the terminal of the LC circuit not bearing the diode is wired a ceramic decoupling capacitor. Finally a galvanometer is wired to the terminals of the decoupling capacitor.
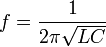
The device will be sensitive to strong sources of radiowaves at the frequency at which the LC circuit is resonant.
This is given by
When the device is exposed to an RF field which is at the resonant frequency a DC voltage will appear on the terminals on the left hand side. The coil is often outside the case of the unit so it can be brought close to the object being probed.
But at VHF and UHF Frequencies ...
At the higher frequencies it is not possible to use lumped components for the tuned circuit. Instead methods such as striplineare used. One design for UHF and SHF is a resonant λ/4 (quarter wave) rod which can vary in length. Another design for X-band (10 GHz) is a resonator cavity which can be changed in length.
As an alternative for UHF, Lecher transmission lines can be used[5]. It is possible to measure roughly the frequency of a transmitter using Lecher lines
Tuned circuit and RF detector coupled to xmtr output
With calibrated dial can tell fundamental frequency
Can tune to harmonics to see how much they are attenuated
Better way is to use spectrum analyzer

But not in most hams' budget!
Enter the SQM
Uses same basic principle as audio distortion analyzer but does it at RF.
An input signal in the HF range, as high as 4 Vpp down to 10 mVpp, is fed to the input. The signal is attenuated and passed through a notch filter to attenuate the fundamental signal. All other components (harmonics of the fundamental and undesirable higher frequency spurious signals) are allowed to pass on for measurements. A logarithmic detector then senses this remaining energy in the spectrum and feeds a bargraph display to show the cumulative amount of remaining off-frequency signals.
The cumulative spectrum energy is indicated by the number of LEDs that are turned on. The lower the number of lighted LEDs, the better the quality is for the signal being measured. Looking at the display in another way, the number of dark (turned off) LED segments can be considered as how much attenuation is present for the cumulative undesired (non-fundamental) areas of the frequency spectrum. As described in the next section, each LED corresponds to approximately 5 dB of signal level; so in the example photo shown below, seven dark segments indicates an average of 35 dB off-signal attenuation.
Input RF signals are fed to terminating resistor R1 and a level-adjust potentiometer R3. The termination resistor is set to a value that will present no more than a 1.5:1 input SWR regardless of the control settings. The level-adjusted signal then feeds a notch filter with several user-selectable configuration options.
The simplest configuration for the SQM is the Fixed Notch Mode, whereby a user-supplied high-Q crystal is used to resonant at the desired signal frequency. When a crystal is plugged into socket X1, the resultant frequency-fixed notch filter will block most of the energy at the fundamental frequency and pass harmonics and spurious signals with little attenuation. The high Q of the crystal resonator also provides a narrow notch that is usable for measurement of close-in spurious signal attenuation. This configuration is useful for single frequency measurements where the source is stable and fixed at a specific frequency, or perhaps when the signal source can be tuned to the fixed frequency of the SQM notch. In this way, for example, a 7.040 MHz crystal used in the SQM may be used to very accurately display the cumulative energy elsewhere in the spectrum when a QRP transmitter is tuned to show a null in the LED display.
Alternatively, instead of using the SQM at a fixed frequency with a crystal, the SQM may also be operated in a Variable Notch Mode by using variable capacitor C8 and inductors L1 and L2. L1 is used for 3–10 MHz operation and L2 allows tuning up to 30 MHz. C1 and either inductor form a series-resonant circuit which has an effective resistance of less than 2 ohms at its resonant frequency. With 200 ohm R2 in series with the input signal, it forms a voltage divider that shunts the fundamental signal to ground at that resonant frequency, allowing all other frequency components of the signal to pass on through for detection and display. This configuration provides strong attenuation of the fundamental and little attenuation of off-frequency harmonics and spurious signals, and is useful in cases when a VFO output signal is being measured.
FET Q1 serves as a high impedance buffer to prevent circuit loading by the log detector IC2. This integrated circuit is an Analog Devices logarithmic detector that produces a DC output corresponding to the log of the RF signal applied at its input. For example an input of -47 dBm (10 mVpp) produces an output of about 1.64 Volts DC. Increasing the input to -7 dBm (100mV) raises the output to about 2.12V. This is a slope of about 24 mV per dB of input.
The 5V regulator IC1 provides clean 5V DC supply voltage to the log detector chip.
This DC output of the log detector is filtered by a simple RC circuit then fed to IC3, an LM3914 LED display driver IC. The LM3914 uses an internal series of voltage dividers, voltage comparators and an precision voltage reference to control a bargraph style display in response to the input DC signal. With the chosen values of R7 and R8 this means that the lowest output L1 turns on with a 120 mV input, L2 also then turns on turn at 240 mV and so on until all outputs are turned on with an input of 2.50 V. IC3 then drives a bargraph array Z1, or an equivalent number of discrete LEDs to provide a visual display. The combination of the log detector chip and the LED driver chip produce a bargraph display over a 50 dB range in ten 5 dB steps.
AD 8310 DC out vs RF in:
SQM detector uses internal VREF of LM3914 bar graph display chip to set up a voltage of 1.5V to the internal voltage divider/comparator
Since output of AD8310 detector chip has a slope of about 24 mV per dB of RF in this gives a display range of about 52 dB or just over 5 dB per segment of the LED bar graph display
LM3914 Bar Graph Array Chip

Great app note ... National Semiconductor Linear Brief 48 ... http://www.ti.com/lit/an/snoa700/snoa700.pdf
SQM in action ... A DDS VFO is connected to the SQM input and C8 is tuned for minimum LED display at 10 MHz
Setup, Calibration & SQM Measurement of a "Clean" signal source (HP8640B signal generator) at 7 MHz ...
"Clean" = single frequency
Viewing a "Dirty" signal source (Elecraft XG3) on Spectrum Analyzer at 7 MHz ...
"Dirty" = square wave, rich with odd harmonics
Setup, Calibration & SQM Measurement of the "Dirty" Signal Source ...
Residual spectrum energy shown at about 15 dB down (3 bars extinguished) from the fundamental (once the fundamental is nulled out by the SQM)
Spectrum of a square wave
The amplitude of any harmonic can be calculated as 2/(p x n).
For 1 1V square wave
3rd harmonic is 0.212V or -13.5 dB
5th harmonic is 0.127V or -17.9 dB
7th harmonic is 0.09V or -20.8 dB
For a 50% duty-cycle ideal square wave, the even harmonics have an amplitude of zero.
Great Reference for Square Waves...
http://www.informit.com/articles/article.aspx?p=1374896&seqNum=7


.jpg)


.jpg)


